EXPERIMENTING WITH EMPIRICAL DATA
Looking for specification clones in metamodels from GitHub
The following experiment is intended to find specification clones in realistic DSL specifications. In doing so, we want to evaluate the relevance of Puzzle as that offers reverse-engineering techniques for facilitating the construction of DSLs.
Experiment replication
Step 1: Downloading Puzzle
To replicate the experiment, you need to download (from this link) a virtual machine that we prepared with a complete installation of Puzzle. You need VirtualBox installed in your computer. The password of the virtual machine is: "osboxes.org".
Step 2: Launching Puzzle
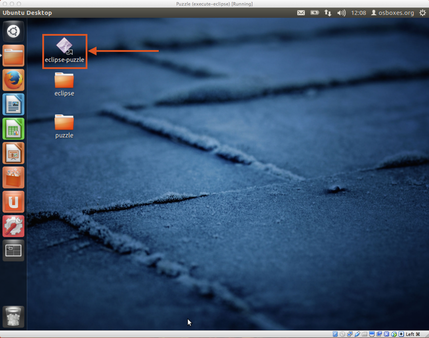
Once you have downloaded and executed the virtual machine, you can execute the eclipse distribution that you will find in the Desktop. Be sure that you locate your workspace in the folder: "/home/osboxes/Desktop/puzzle".
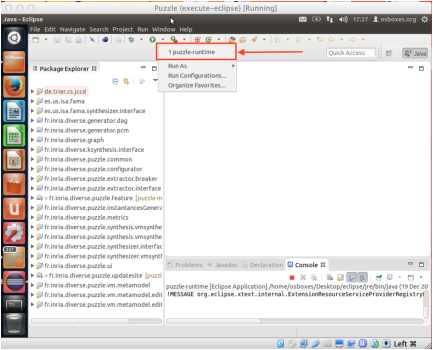
Then, you can execute a second instance of eclipse to load the Puzzle plugins. Choose the configuration called "puzzle-runtime".
Step 3: Execute the experiments
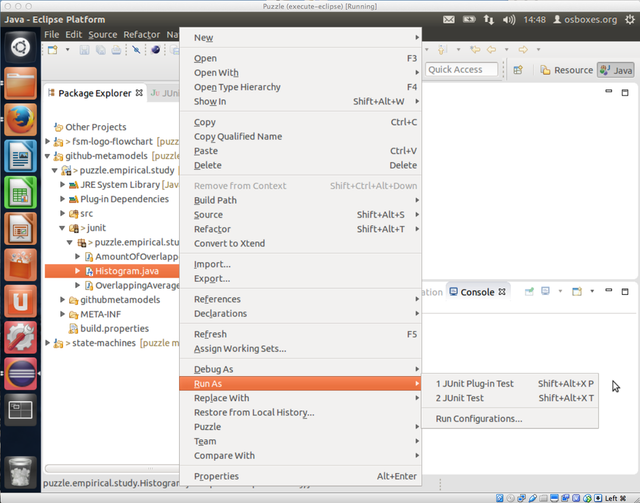
Once you have launched Puzzle, you can execute the experiments. In particular, you can obtain the O(i,j) matrix as well as the data used to generate the charts presented in the paper. You need to look for the java file called Histogram, and run it as Plug-in Junit Test.
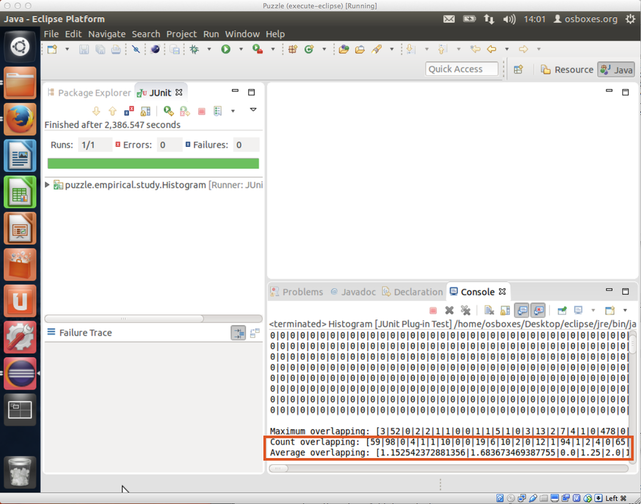
Warning! The data we use in the experiments is located in the folder githubmetamodels, and can be replaced to test different data sets. The results will appear in the Eclipse console. Note also that we are analyzing about 2.400 metamodels, and some of them have more than 5.000 metaclasses. Be patient! The execution time is about 15 minutes.
Note that the data for the construction of the charts is produced as a set of arrays. Each array corresponds to a different chart. The array called: "count overlapping" is used to generate the first chart in Figure 10. In this array, each position i represents one metamodel. The value in the position i indicates the amount of metamodels that have some specification clones (i.e., overlapping) with the metamodel i. Similarly, the array called "average overlapping" is used to produce the second chart of the Figure 10. In this array, each position i represents one metamodel. The value in the position i indicates the average amount of cloned metaclasses with the other metamodels of the set. Put your arrays on an Excel sheet, create a dots cloud, and compare your results!
Note that you can add or remove metamodels from the folder githubmetamodels. This can be useful for performing smaller experiments running faster.